 |
|
|
Mike Caplinger, Malin Space Science Systems September 1994
Annual changes in temperature on a planet are caused by a combination of two factors: axial tilt and variable distance from the Sun. On Earth, axial tilt determines nearly all of the annual variation, because Earth's orbit is nearly circular. But Mars has the highest orbital eccentricity of any planet except Mercury and Pluto; the distance from the Sun to Mars varies from 1.64 AU to 1.36 AU over a martian year. This large variation, combined with an axial tilt slightly greater than Earth's, gives rise to seasonal changes far greater than those we experience even in the coldest areas on our own planet.
The temperature of a location on a planet is largely determined by the amount of sunlight falling on that location. If planets had no axial tilt, then the temperature would be greatest at the equator, where sunlight falls most directly, and would drop towards the poles. However, if the planet has axial tilt, the angle at which sunlight falls on a point will change throughout the year. For example, the poles will be in darkness for half the year, and in sunlight the other half.
The effect of the axial tilt of Mars can be seen in the following image. The topmost image shows the vernal equinox, or start of spring in the northern hemisphere, when the sun falls directly at the equator. On the left is the summer solstice, when the pole is in sunlight during the entire day. At the bottom is the autumnal equinox, when the sun again falls directly at the equator, and finally on the right is the winter solstice, when the north pole is in continuous darkness.
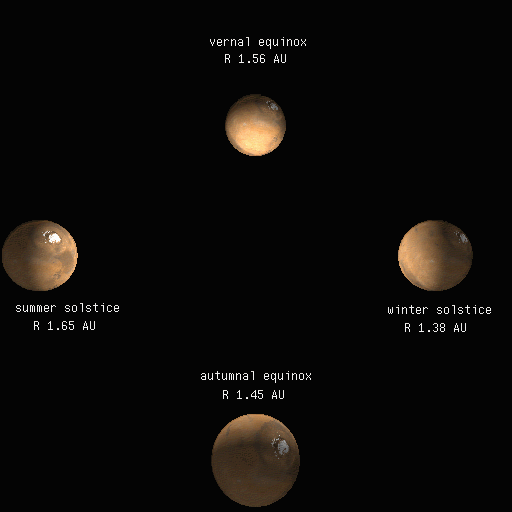
Note that the solstices and equinoxes are named for the seasons in the northern hemisphere; conditions are reversed in the southern hemisphere. Scientists studying seasonal changes on Mars often use the solar longitude (also known as L sub s or Ls), to indicate the season. Ls is the angle from the Mars-Sun line to the Mars-Sun line at the vernal equinox, so at the vernal equinox, Ls is 0. For example, at the summer solstice, Ls is 90, and at the winter solstice, Ls is 270.
Annual variations, such as the growing and shrinking of the polar caps, have been observed from Earth for hundreds of years, although it was not until spacecraft visited the Red Planet that it was recognized that these variable caps are not composed of water, but of carbon dioxide (CO2) frost. During the polar darkness, temperatures drop below the point at which CO2, the primary constituent of the martian atmosphere, turns from a gas to a solid. So much carbon dioxide freezes out of the atmosphere that the global atmospheric pressure decreases by 25%.
We can see this variation in measurements taken by Viking Lander 1. This table, of average atmospheric pressure over the course of three martian years, shows that the pressure at VL1 changes from less than 7 millibars (mb) to almost 9 millibars over a year.
day of
year	pressure (mb)
----	--------
0	8.0
57	8.25
114	8.4
172	7.75
229	7.0
286	6.9
343	7.25
400	8.0
458	8.8
515	8.9
572	8.5
629	8.0
The atmospheric pressure is controlled by a complex balance between the cold and warm pole. When the south pole is in total darkness, the north pole is experiencing continuous sunlight, so we might expect that the pressure would stay roughly constant over the year, as CO2 vaporized at one pole only to freeze at the other. However, remember the eccentricity of Mars' orbit -- this causes the solar input when one pole is in sunlight to be significantly different than that when the other pole is in sunlight. We can plot the solar input, or insolation, as a function of time in the martian year (horizontal axis, with the start of northern spring at the left) vs. latitude (vertical axis, with the south pole at the bottom.) Blue indicates the least insolation, and red the most.
 Insolation at noon
 Pressure at VL1
Note that the insolation image shows that summer in the southern hemisphere is much warmer than summer in the northern hemisphere, because Mars is farther from the Sun during northern summer. (In contrast, the eccentricity of Earth's orbit is low, and although Earth is actually closer to the Sun during northern winter, the effect of the small variation in solar distance is not noticable.)
Below the insolation plot, we have plotted the pressure at VL1 as a smooth curve. Note that it reaches a maximum during southern spring and summer, has its deepest minimum near the end of southern winter, and has a smaller minimum at the start of northern spring.
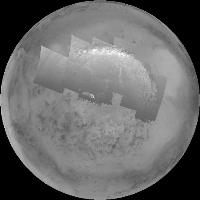
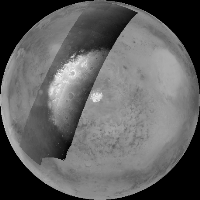
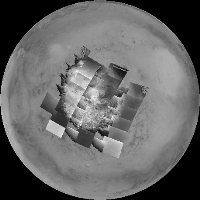
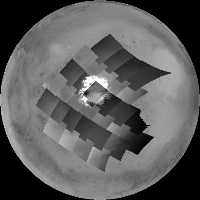
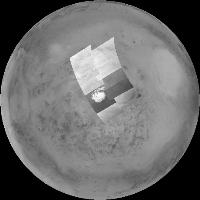
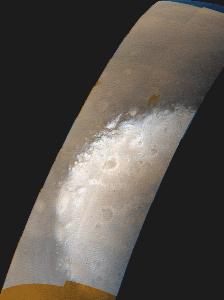 Viking Orbiter 2 Orbit 161 Ls 195.2 1/30/1977
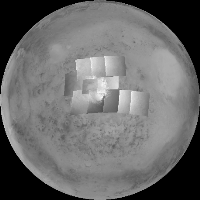
In 1977, Viking Orbiter 2 acquired sporadic coverage of the recession of the southern polar cap. Using software developed for Mars Observer Camera (MOC) mission planning, I took 300 VO2 images and constructed the following crude "movie" of the cap shrinking. (Unfortunately, variability in lighting and resolution caused by the eccentricity of VO2's orbit, and the use of different filters and exposure times, make the quality of these mosaics rather poor. In 1998, we hope to make a one-frame-per-day movie of the cap recession, in color and with uniform resolution and brightness, using MOC2 data from Mars Global Surveyor.)
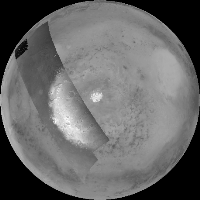
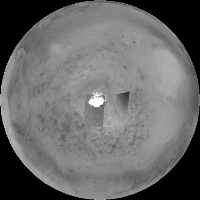
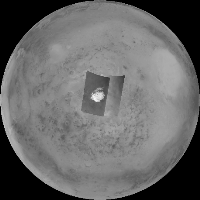
 Orbit 142 Ls 183.1 1/9/1977
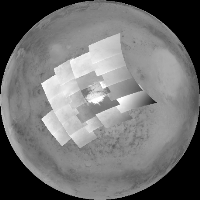
 Orbit 161 Ls 195.2 1/30/1977
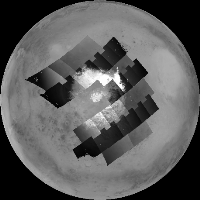
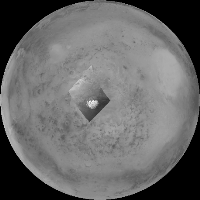
 Orbit 163 Ls 196.5 2/7/1977
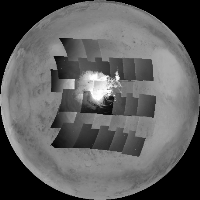
 Orbit 225
 Orbit 241 Ls 247.0 4/24/1977
 Orbit 267 Ls 262.2 5/19/1977
 Orbit 287 Ls 274.5 6/7/1977
 Orbit 292 Ls 277.5 6/11/1977
 Orbit 313 Ls 289.7 7/1/1977
 Orbit 335 Ls 302.2 7/22/1977
 Orbit 348 Ls 306
 Orbit 352 Ls 311.8 8/7/1977
 Orbit 402 Ls 338.2 9/23/1977