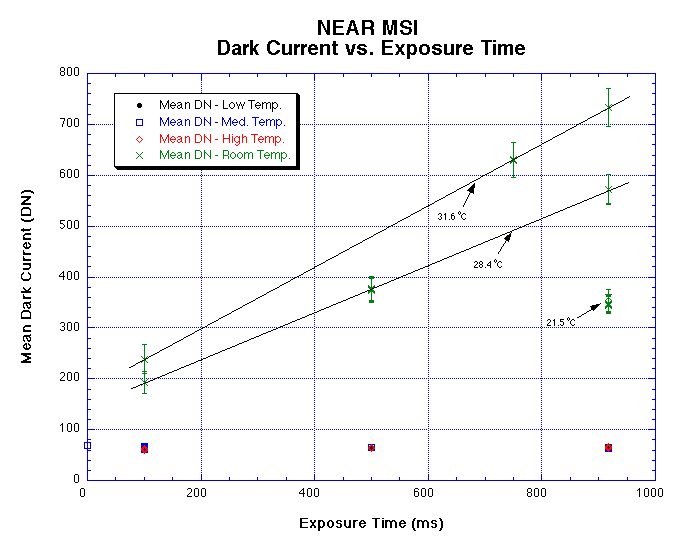
Reference lines have been drawn on Figure 1 to show the correlation between points that were acquired during three different room temperature conditions corresponding to 21.5, 28.4 and 31.6 degrees C.

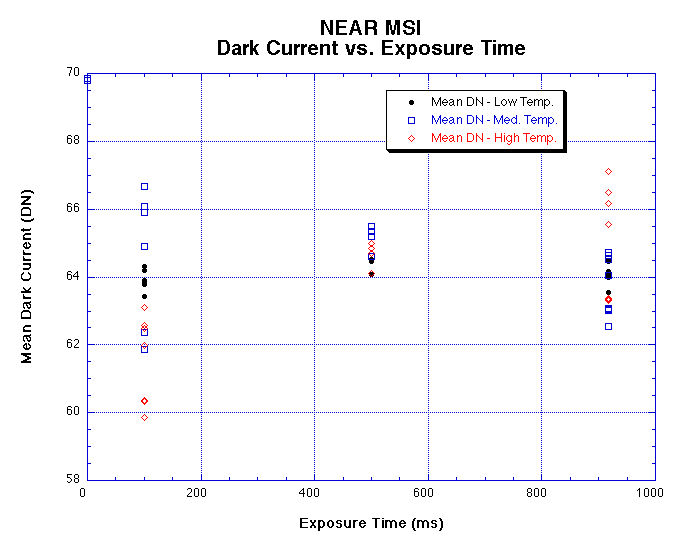
Figure 2 shows an expanded view of Figure 1 to illustrate the variation at cold temperatures. The variability of the low and medium temperature points falls well within the 6 DN standard deviation of the data. It is unclear whether the increasing trend of the high temperature points is real since the standard deviation of these points is 5 DN (very close to the average offset between the 100 millisecond and 917 millisecond observations).

Dark Current Versus Temperature
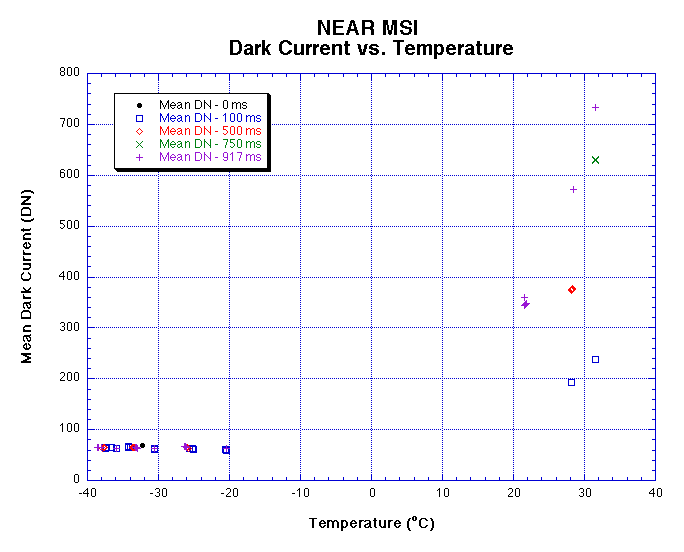
Figure 3 shows a plot of the same numbers used in
Figures 1 and 2, but plotting mean signal values against the
temperature at which they were measured. Table 2 provides this data in tabular form,
along with the names of the image files that were used in the
analysis.

Conclusions
The graphs on this page argue that exposure time does not influence
the observed dark current until the temperature is well above nominal
operating temperatures. This analysis, however, has ignored the even/odd pixel variation inherent
in the system. Accounting for this variation may provide insight
into whether dark current is increasing with exposure time in the high
temperature case. Refer to the full instrument
dark current analysis for more information on this subject.