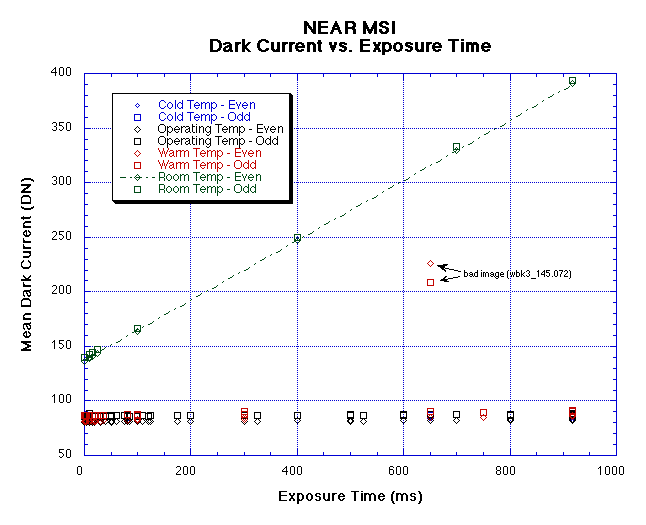
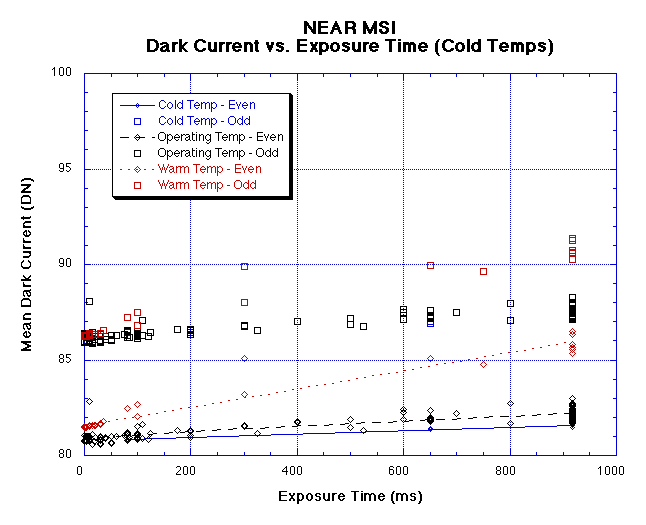
While the MSI was held at a nearly constant temperature, multiple images were taken at different exposure settings. For the piecepart analysis the average DN value of the clean area of the detector was plotted against the exposure time. In this analysis, the average DN value is again computed for the same area of the detector, but a separate average is computed for both the even and odd pixels. This is to account for the observed even/odd pixel variation inherent part of this system. Recall that this report defines the leftmost pixel of the detector to be "even".
Figure 1 shows the plots that were generated at various temperature conditions. Table 1 shows the same data in tabular form along with the names of the image files that were used in the analysis.
Note in Figure 1 the bad data point that arises from image WBK3_145.072. This image exhibited a single line of noise that was not observed in other datasets. Information has not yet been obtained as to the source of this noise.

Figure 2 shows an expanded view of Figure 1 to illustrate the variation at low temperatures. The variability of the cold and operating temperature points correspond to the standard deviation of the data that was measured to be approximately 0.6 DN. However, the offset between the 1 ms and 917 ms warm temperature exposures is nearly 4 DN. This appears to be a real increase in dark current since the standard deviation of these data are still approximately 0.6 DN.

Dark Current Versus Temperature
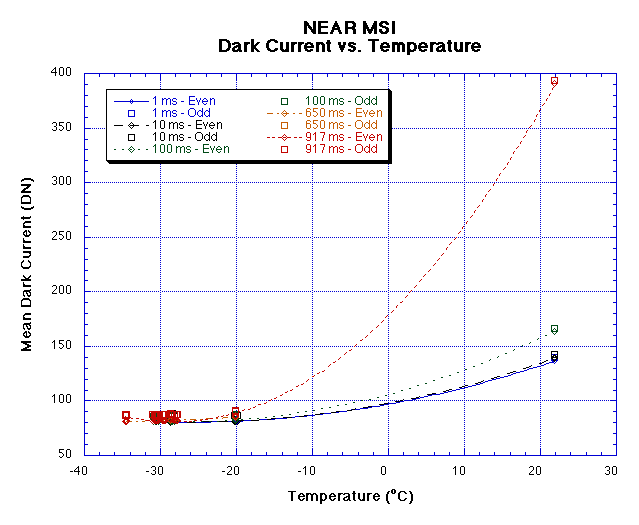
Figure 3 shows a plot of the dark current signal
as a function of temperature. Once again, distinct means have been
computed for the even and odd pixels to account for the even/odd pixel variation. Since
the previous plots showed that there could be a small amount of
variation based on exposure time, the dark current signal as a
function of temperature has been plotted for several different fixed
exposure settings. Table 2 shows
the same data in tabular form along with the names of the image files
taht were used in the analysis.

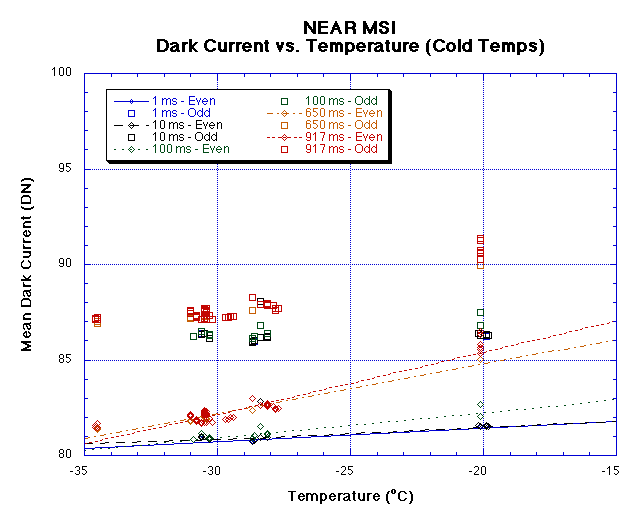
Figure 4 shows an expanded view of Figure 3 to emphasize the variation at low temperatures. This plot further illustrates the possibility that dark current increases as a function of exposure time at temperatures above -20° C.

Observations
A few points of interest arise by comparing these results with those
found in the piecepart dark current analysis.
The first thing to notice is the 20+ DN difference between the two
datasets for all temperatures and exposures. Scott Murchie indicates
that this is consistent with a change in the fixed offset introduced
into the instrument between the piecepart and full instrument testing.
Unlike the piecepart analysis, these graphs argue that dark current as a function of exposure time is not neglible at temperatures as low as -20 -> -25 C. Further dark images should be acquired during cruise to better understand these characteristics.